You Have a TMS but Your Routes Are Not Optimised: Add the Brain via API
Many Vietnamese fleets already run TMS, WMS and GPS, but the sequence of delivery stops is still worked out by a person. This piece explains how to add a decision layer (a VRP solver) via API without replacing the system you already run.
Dr. Thái Phạm
Cố vấn vận trù học, Route4Green
In this article
Digitised does not mean optimised
Many fleets in Vietnam are no longer fully manual. Vehicles carry GPS, orders sit inside a TMS or WMS, dispatchers can watch each trip on a screen. But one step still sits outside the software: the order in which stops are visited on a given trip. That is still worked out by one person, usually from experience and a feel for familiar routes, not by a computer comparing options.
In other words, the fleet has finished digitising recording and monitoring, but not decision making. Those are two different things.
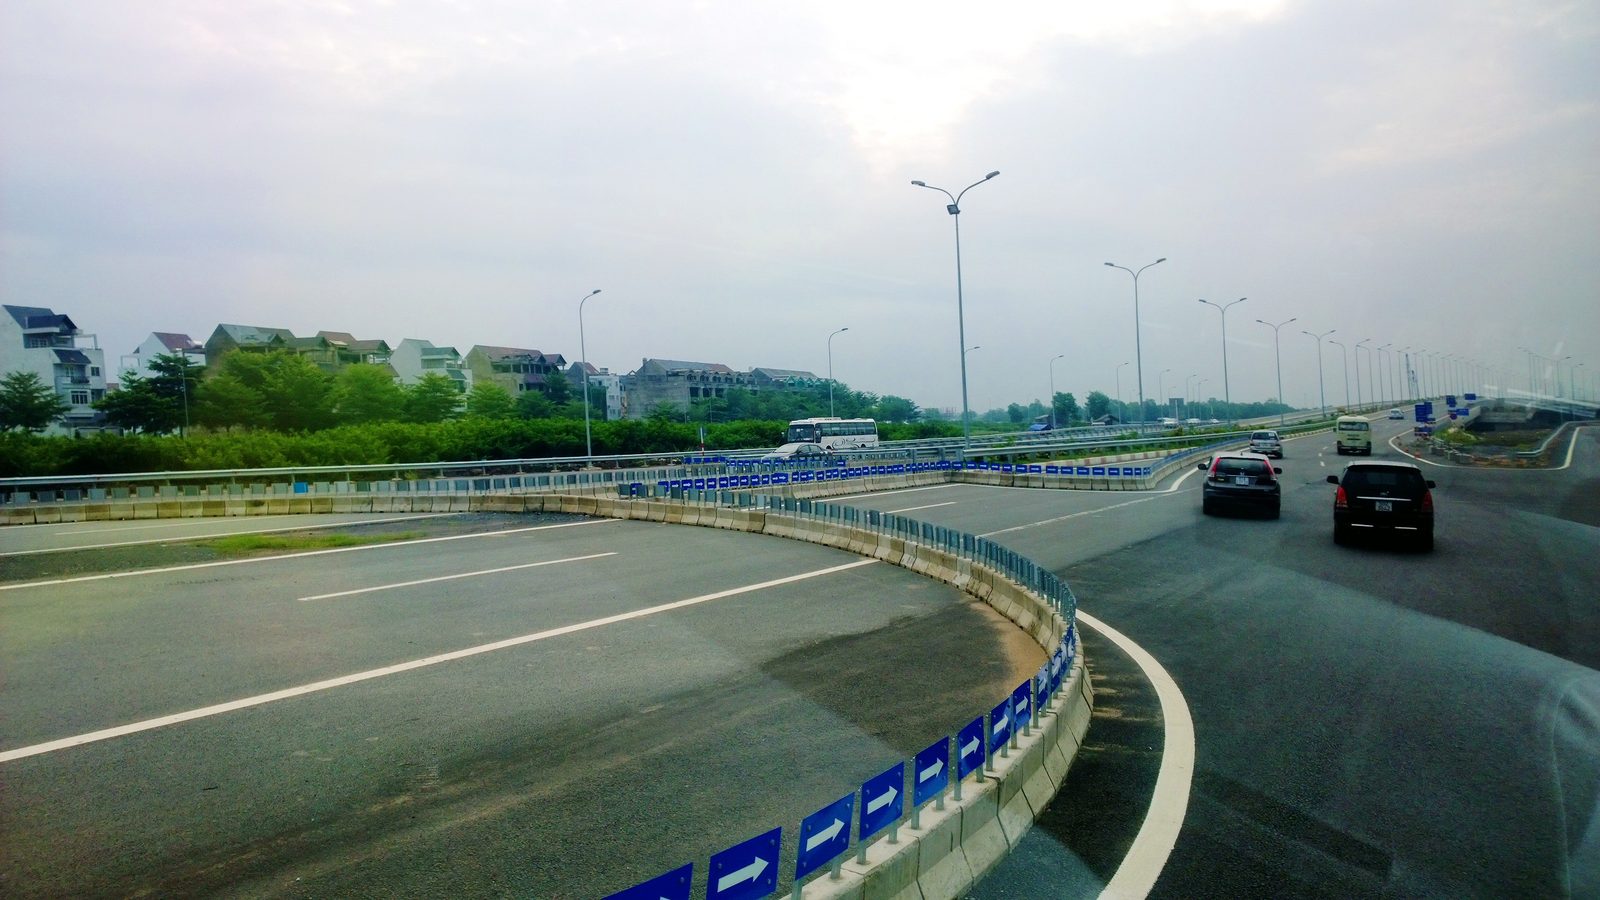
Three things often lumped together as “transport software”
In practice there are three different software layers, though many places call them all “transport software”:
- Monitoring: a GPS or FMS system, showing where a vehicle is, how many kilometres it has run, where it has stopped.
- Recording: TMS or WMS, storing orders, customers, warehouse data, delivery status.
- Decision making: a solver for the constrained routing problem (VRP), which works out the order of stops and the assignment of orders to vehicles so that total distance or cost is as low as possible within the allowed constraints.
According to a 2021 survey by the Vietnam Logistics Research and Development Institute (VLI), cited by VietnamPlus in 2025, 61.11% of logistics service companies already used a TMS and 63.89% used WMS/OMS, but only 19.4% used route optimisation (VRP) software. The first two layers are already common. The third layer, decision making, remains an empty slot in most companies.
Who is actually sequencing the delivery stops?
In most fleets, the person sequencing delivery stops is a dispatcher, working in Excel or coordinating directly with drivers over Zalo. This is an observation from real fleet operations, not a measured statistic, but it is common: the dispatcher looks at the day's order list, recalls familiar routes, estimates the time windows customers asked for, and sequences stops by experience.
This works fine while the fleet is small. But once a fleet passes roughly 15 to 20 vehicles a day, the combination of stops, time windows, load capacity and vehicle count goes beyond what one person can hold in their head, however experienced they are.
Why now
Three pressures are piling onto transport cost at the same time.
First, service prices keep rising. According to the General Statistics Office (GSO), 2026, the transport and warehousing services price index rose 13.16% in 2024 and rose a further 7.26% in the first half of 2026.
Second, expressway tolls charged by the kilometre are now published in plain figures. According to VnExpress, 2026, the 2026 North-South expressway toll for group 5 vehicles (18 tonnes and above) is about 1,072,909 dong for 774.6 km across 13 state-invested sections, roughly 1,385 dong per kilometre. Every extra kilometre driven on the expressway now has a specific price tag.
Third, a driver shortage forces every vehicle still on the road to work harder. According to the Vietnam Automobile Transportation Association (VATA), cited by Thanh Nien, 2026, about 25 to 30% of container tractor trucks nationwide are parked idle for lack of drivers, and in major cities that share reaches 30 to 50%.
Put together, these three figures mean: prices are not falling, road tolls are not changing, and the number of available vehicles is tending to shrink. Wasted kilometres, meaning distance driven beyond what is needed to complete all deliveries within allowed constraints, are close to the only cost a business can cut through its own decisions, independent of the market.
What the actual problem is
Many people picture routing as “finding the shortest path between two points”. That is a different, much simpler problem than what fleets actually face.
The real problem is a constrained routing problem, usually called VRP (Vehicle Routing Problem). Given a set of orders and a set of vehicles, the task is to work out which vehicle delivers which order, in what order, while still satisfying constraints such as the time window a customer requested, the maximum load of each vehicle, the number of vehicles available that day, and truck curfew hours in certain inner-city zones. This is a combinatorial problem: the number of possible arrangements grows very quickly with the number of stops, and there is no way for one person to work it all out by hand or with a simple formula.
No need to replace the TMS
Adding this decision layer does not mean replacing the system you already run. The TMS or WMS keeps doing what it does: storing orders, customers, delivery status, as a recording system. The routing solver is a different layer: a decision-making layer.
The two layers talk to each other through an API. The usual flow is: the existing system sends the list of orders and vehicles over an API call, the solver runs as an asynchronous job, returns a route plan, and that plan is written back into the TMS. Authentication between the two sides uses an api-key, without needing deep integration into the internal data structure of the existing system.
This model is not unique to Route4Green. International providers such as Google, NextBillion and Timefold describe the same layering: the system holds the data, the solver makes the decision, the system is not replaced. Domestic platforms that do full route optimisation also exist, which shows the demand is real. What sets Route4Green apart is the form factor: an API layer that plugs into whatever is already running, rather than asking a fleet to switch systems.
Measured proof
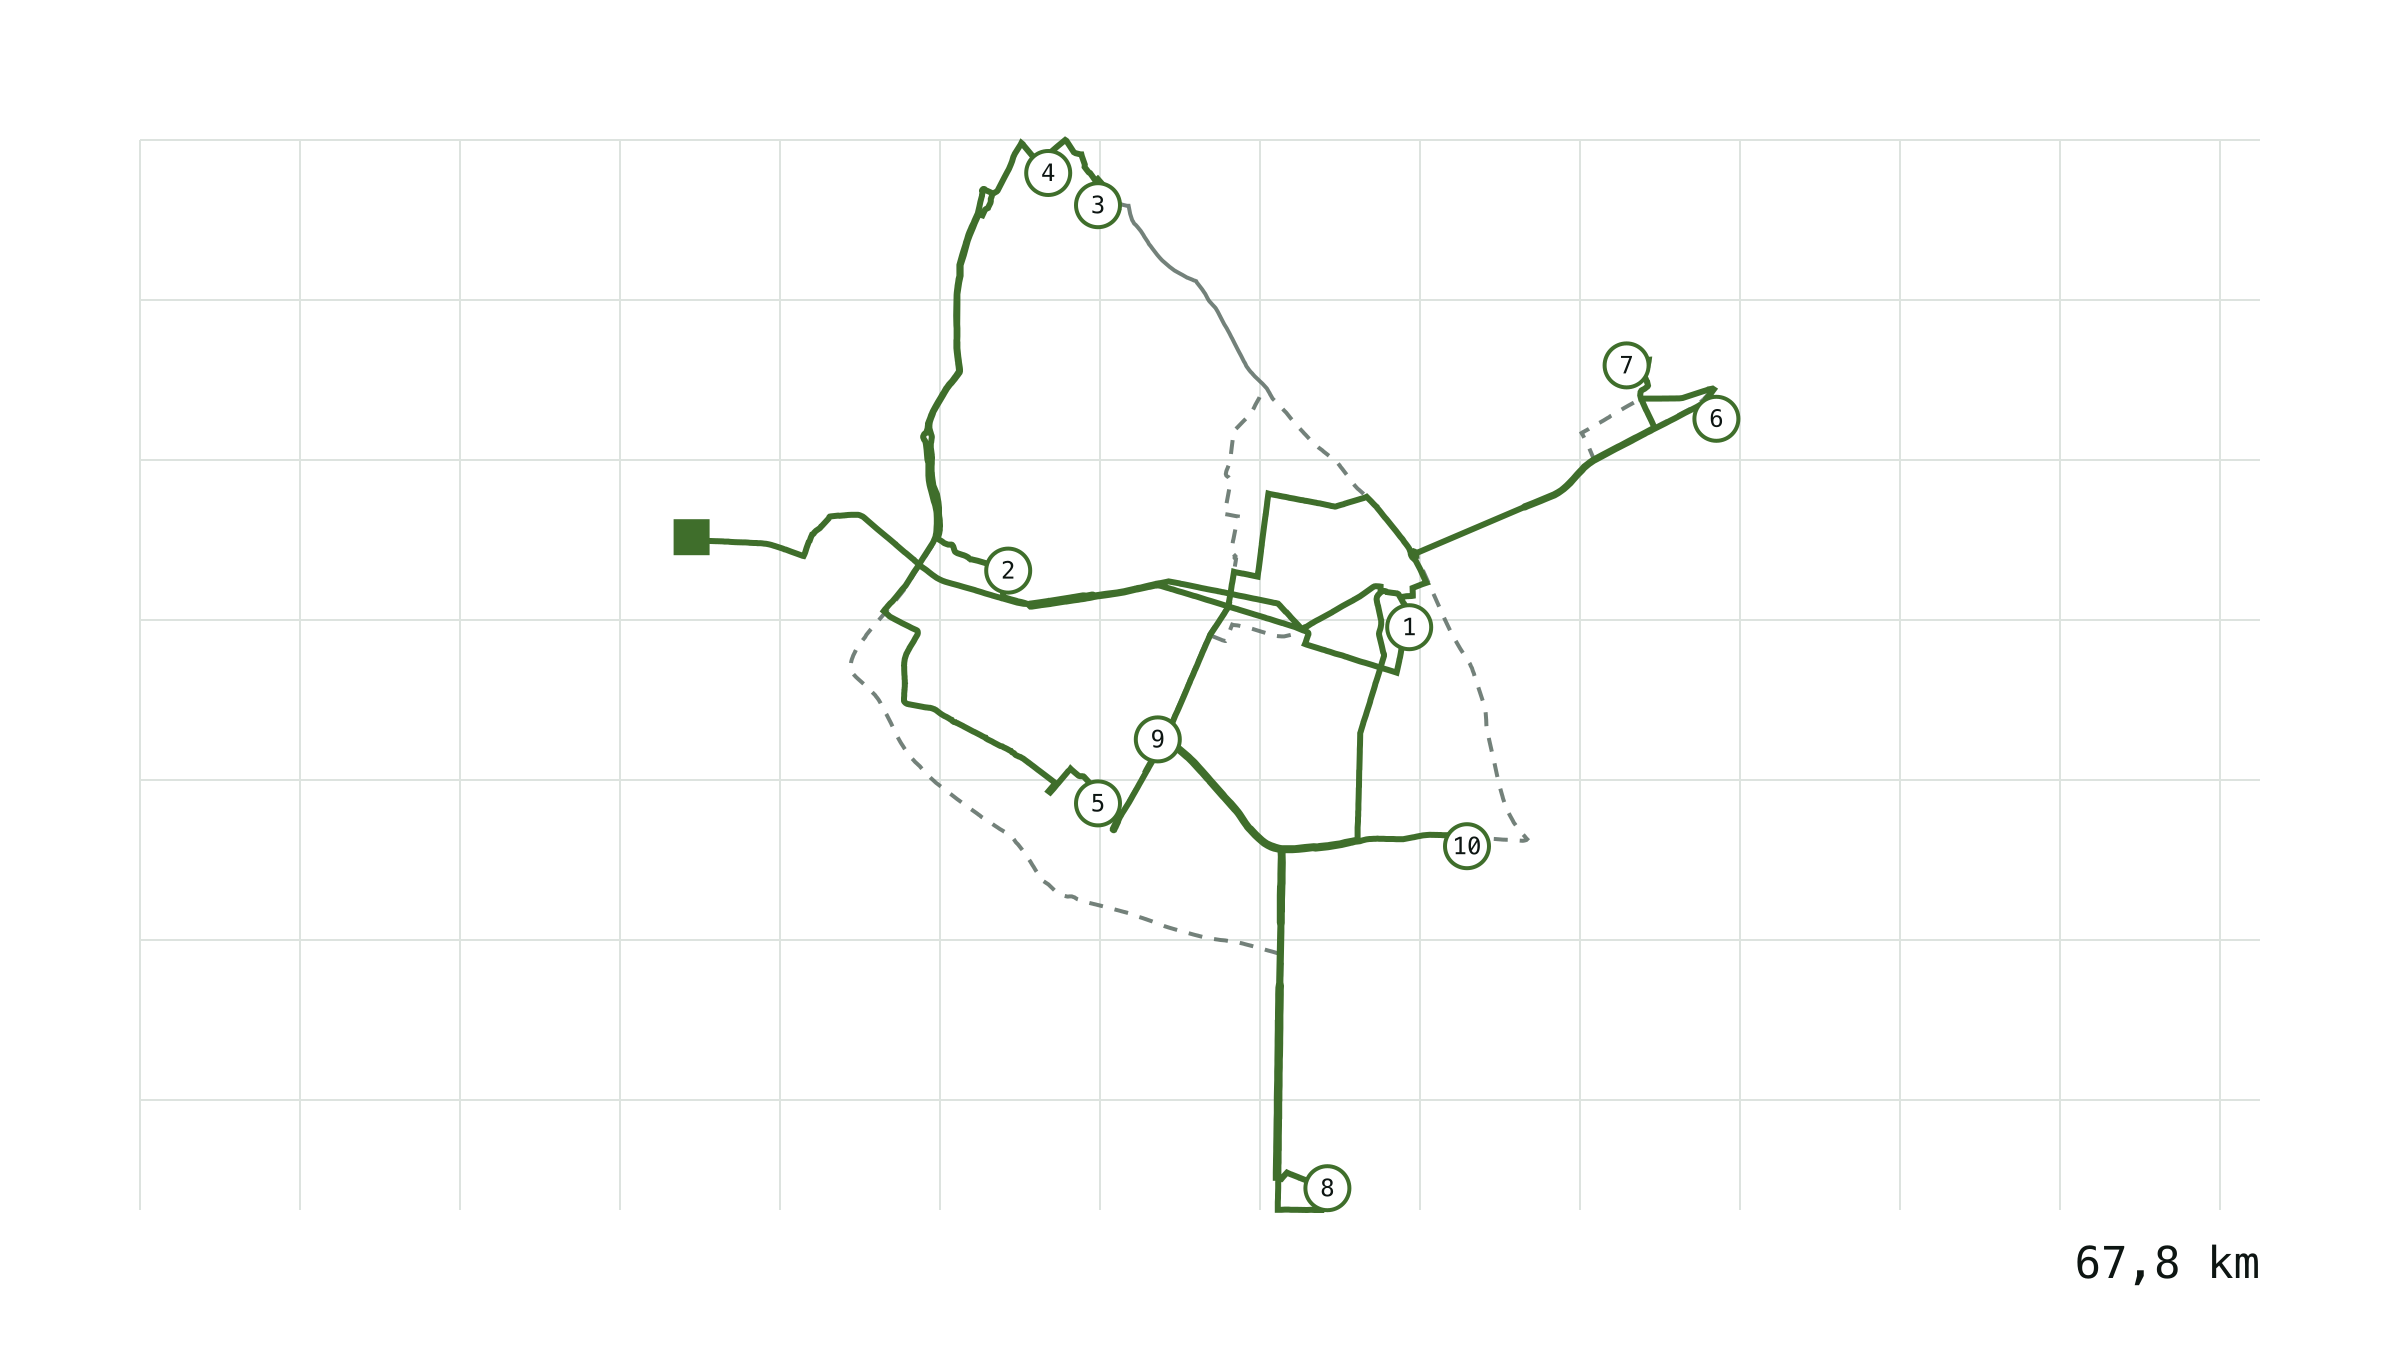
Route4Green has one specific measured case: a delivery route in Thai Nguyen, with anonymised data, measured on a single real run. This is not an average across multiple routes, and it is not a simulation: it is one route, measured once.
The main argument in this case is the money saved from a shorter distance compared with the original manually sequenced plan. The accompanying CO2 figure only serves as supporting evidence for the cost story, together with its measurement scope and date, and is not an independent environmental claim.
Start within a week
The simplest way to check this without touching the system you already run: take one real route from your fleet, let the dispatcher sequence it as usual, run the same data through the solver via API at the same time, then compare the total distance of the two plans. This does not replace the TMS or change the existing process, it just runs in parallel to show the difference on that fleet's own data.
If you want to try it this way, get in touch through the trial page.